6.6M Tokens. $4,800. Zero Visibility. So I Built a Dashboard.
I've been grinding Claude Code on a Max 20x plan for months. This month alone: 6.6 million tokens, $4,800 equivalent, 129 sessions. And until last week, I had zero visibility into where any of it was going.
That's the problem nobody talks about with heavy AI usage. Enterprises are mandating adoption. Engineers are shipping with AI every day. But almost nobody is measuring consumption at the session level. They're flying blind — then acting surprised when the economics don't add up.
I wasn't going to be that person. So I built a dashboard.
AI Token Cost: You Can't Optimize What You Can't See
Claude Code writes session data to ~/.claude/projects/**/*.jsonl files. Every request, every response, every cache hit — it's all there. But it's raw JSONL spread across hundreds of files. Nobody's reading that.
I wanted answers to basic questions: How many tokens am I burning per day? Which models are doing the heavy lifting? What's my cache hit rate? Are my high-token days actually my most productive days?
No existing tool gave me that. The Tauri-based ai-token-monitor is solid, but it's a desktop app. I needed something that works on headless servers, remote dev environments, and CI workflows — anywhere I'm running Claude Code.
What I Built: A Token Monitoring Dashboard
react-ai-token-monitor — a lightweight web dashboard that parses Claude Code session files and serves real-time analytics. Node/Express backend with chokidar file watching, React frontend with pure SVG charts, Server-Sent Events for live updates. No external chart libraries. No data leaves your machine.
The stack is deliberately minimal: Express 5, React 19, Vite 8, TypeScript. The backend watches your JSONL files, incrementally parses new entries (no re-reading entire files), deduplicates by message ID, and pushes updates to connected clients via SSE.
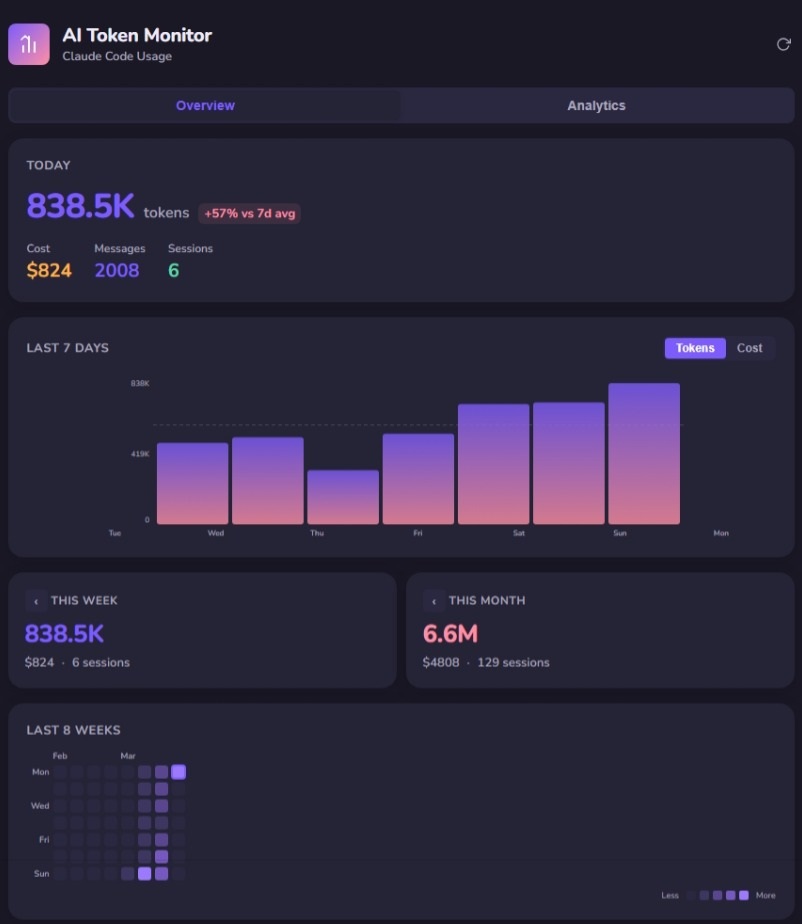
Overview tab: Today's stats, 7-day trend with token/cost toggle, weekly and monthly totals, 8-week contribution heatmap.
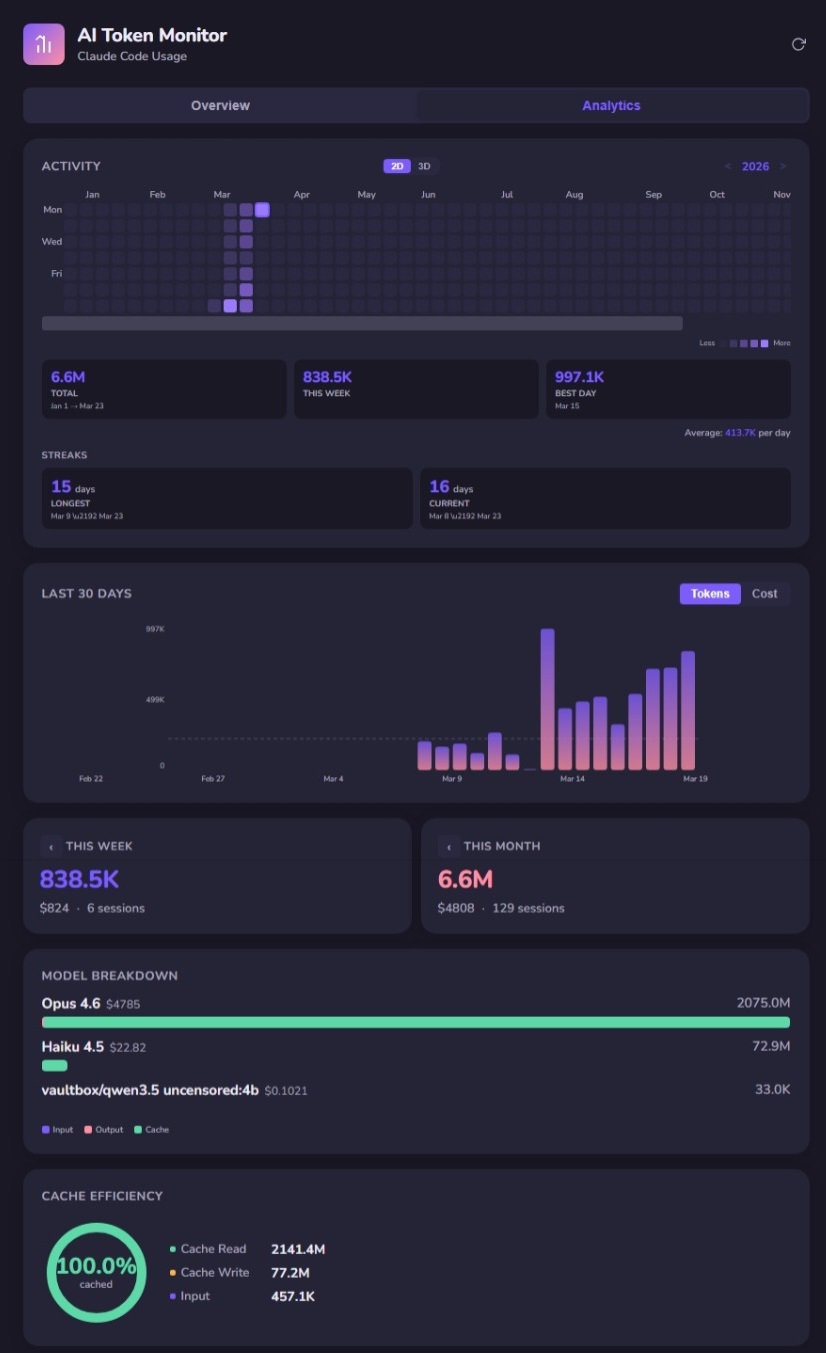
Analytics tab: Full-year activity heatmap, usage streaks, 30-day trend, model breakdown, and cache efficiency.
What the Data Reveals
Here's where it gets interesting. The dashboard isn't just a vanity metric — the data tells a story about how Context Engineering actually works in practice.
Cache Reads Dominate Everything
My cache efficiency is sitting at 100% cached. Cache reads: 2,141.4M tokens. Cache writes: 77.2M. Raw input: 457.1K. That ratio is staggering. It means the overwhelming majority of my context is being served from cache, not recomputed.
This isn't accidental. This is what happens when you engineer your context deliberately — CLAUDE.md files, ADRs, structured project context. The model isn't re-reading your entire codebase every request. It's reading cached context that you've designed to be stable and reusable.
That's Context Engineering in a single metric: cache read ratio.
Model Choice Matters Less Than You Think
My model breakdown: Opus 4.6 at $4,785 (2,075M tokens), Haiku 4.5 at $22.82 (72.9M tokens). The cost difference is dramatic, but the insight is subtler. Haiku handles the lightweight operations — quick lookups, simple edits, file searches — while Opus does the heavy reasoning. The system routes intelligently when you let it.
This mirrors what we see in enterprise deployments: the expensive model isn't the problem. The problem is sending expensive-model work to the expensive model when a cheaper model would produce identical results. Visibility into per-model consumption is how you catch that.
High-Token Days Are Not Always High-Output Days
My best single day was 997.1K tokens. But looking at the 7-day trend alongside what I actually shipped, some of my highest-token days were refactoring sessions — high consumption, modest output. Meanwhile, some lower-token days produced entire features because the context was dialed in.
This is the “activity vs. impact” trap at the individual level. The same trap that enterprises fall into when they mandate AI adoption without governance. More tokens does not mean more value. Targeted context does.
Why This Matters Beyond My Dashboard
This is a personal tool built for my own usage patterns. But the principle scales directly to teams.
At OutcomeOps, we obsess over making AI consumption predictable, efficient, and auditable. This dashboard is a micro-example of the same discipline: tracking every input and output so you can self-correct, reduce waste, and compound savings across sessions.
What token-level visibility enables:
- Cost forecasting — Know what AI is costing before the bill arrives, not after
- Prompt optimization — High cache reads mean your context is well-engineered; low cache reads mean you're wasting compute
- Model routing validation — Are expensive models being used where cheap ones would suffice?
- Governance in regulated settings — Audit-ready consumption logs without shipping data to third parties
Context Engineering isn't just about what you feed the model. It's about designing environments where AI thinks efficiently. A token dashboard is the feedback loop that closes the gap between “I'm using AI” and “I'm using AI well.”
Try It
The repo is public: outcomeops/react-ai-token-monitor. Three commands to get running:
git clone https://github.com/outcomeops/react-ai-token-monitor.git
cd react-ai-token-monitor
npm install && npm run dev
It binds to 0.0.0.0:5173 in dev mode — accessible from any machine on your network. All data stays local. No accounts, no telemetry, no external API calls.
If you're grinding Claude Code daily, you should know where your tokens are going. Feedback and PRs welcome.
Engineers who own the outcome start by owning the data.
OutcomeOps: The Future of AI Engineering
Opens Substack in a new tab to confirm. No spam — unsubscribe anytime.
This Dashboard Is Table Stakes. What Comes Next Is the Platform.
Token visibility for one engineer is useful. Token visibility, context governance, and self-correcting AI across an enterprise — that's OutcomeOps.
If your team needs AI that traces to ADRs, respects compliance, and delivers merge-ready code without IP risk — let's talk.